
Executive Summary
Motor vehicle crashes remain one of the leading causes of injury and death in the United States: not because the problem is unsolvable, but because the two biggest causes, speeding and impaired driving, are almost entirely preventable. In 2024, 39,254 people were killed on U.S. roads, and an estimated 2.42 million more were injured. [1] Early 2025 estimates show 36,640 deaths: a continuation of modest declines, but still 8% higher than pre-pandemic 2019 levels. [1]
Three Press-Worthy Statistics
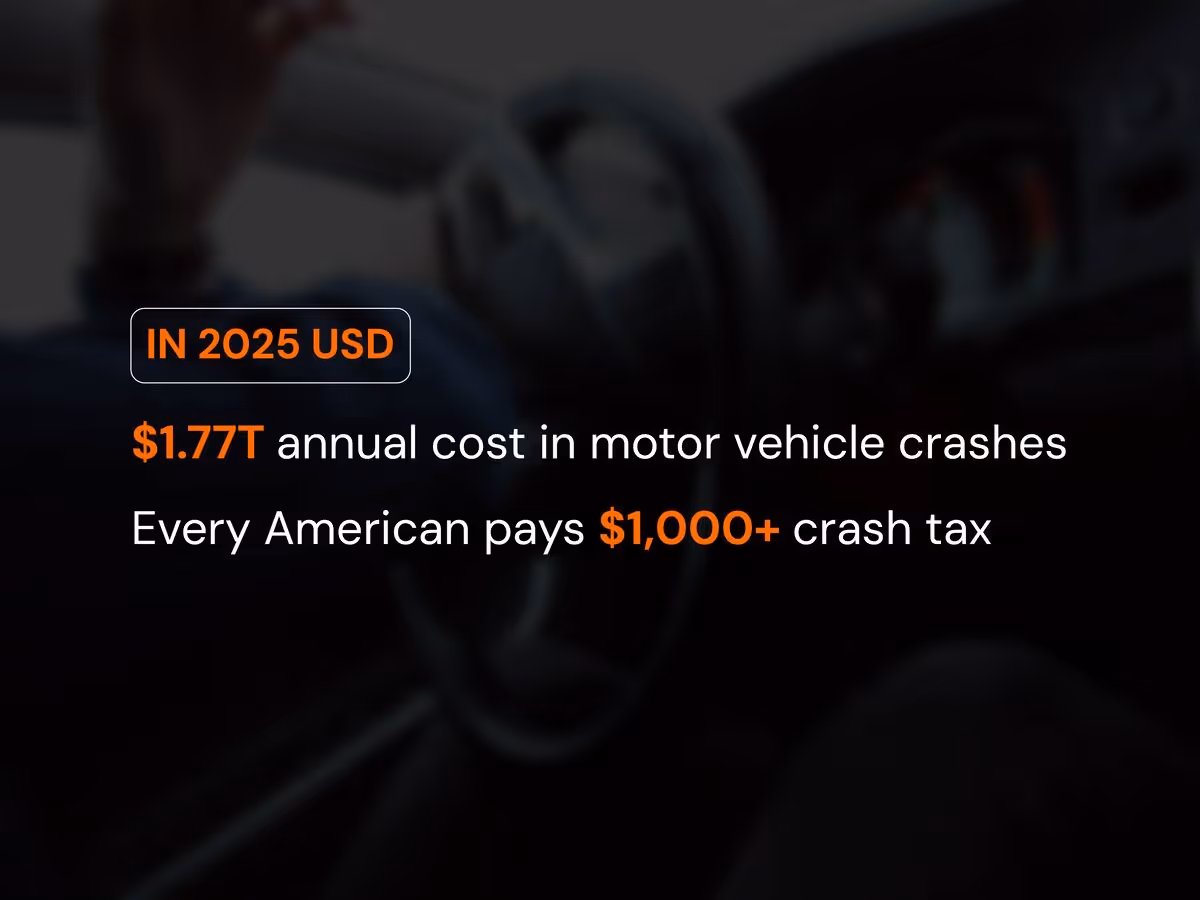
- Motor vehicle crashes cost the U.S. economy $1.4 trillion in total societal harm in 2019: equivalent to $1.77 trillion in 2025 dollars: meaning every American effectively pays a $1,000-plus annual crash tax. [2]
- Speeding was a contributing factor in 29% of all U.S. traffic fatalities in 2023, killing 12,151 people: an average of 33 lives per day. [3]
- Alcohol-impaired driving killed 13,524 people in 2022: one death every 39 minutes: and remains the single largest contributor to fatal road crashes. [4]
Why This Report Matters
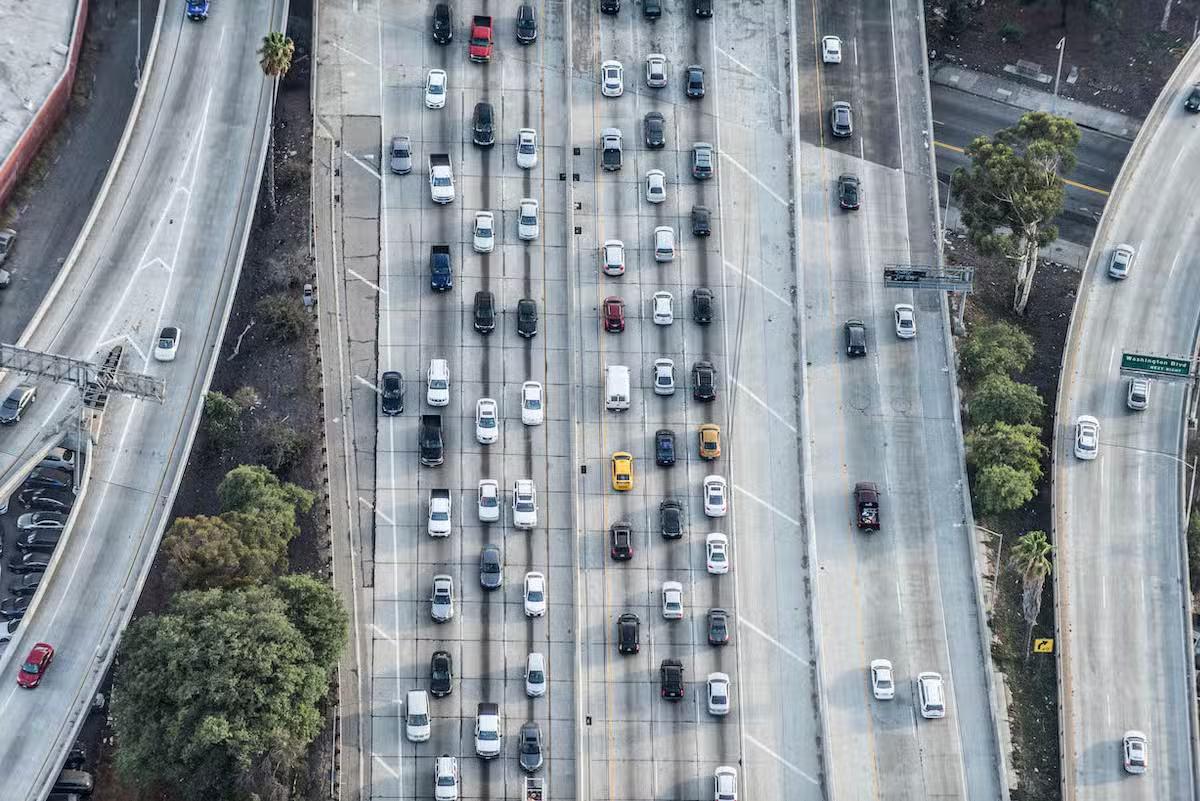
California, Arizona, and Nevada: where Avian Law Group operates: consistently rank among the most dangerous states for speed- and impairment-related crashes. Arizona posted the second-highest fatality rate per 100 million vehicle miles traveled in the country in 2023. [5] Los Angeles County alone recorded 11,120 crashes in 2024. [6]
For victims injured by a speeding or impaired driver, the legal framework in these three states provides strong pathways to full compensation. Understanding that framework: and acting before statutes of limitations expire: is what separates adequate recovery from inadequate recovery.
Section 1: The Scale of the Crisis: 39,254 Dead in 2024
National Fatality and Injury Totals
The National Highway Traffic Safety Administration's final 2024 data confirmed 39,254 deaths in U.S. motor vehicle crashes: a 3.8% decline from 40,901 deaths in 2023. [1] Injuries tell a grimmer story: an estimated 2.42 million people were injured in 2024, with only a slight decrease from the 2.44 million injured in 2023. [1] Reduced fatalities have not translated into reduced injuries.
The Decade-Long Trend
- 2014-2023: fatalities rose 25% over the decade despite major advances in vehicle safety technology. [5]
- 2023: 40,901 killed and 2.44 million injured: a 4.3% fatality decrease from 2022, but a 2.5% injury increase. [5]
- 2024: 39,254 killed and 2.42 million injured: further fatality decline, injuries remain near peak. [1]
- 2025 early estimates: 36,640 killed: still 8% above pre-pandemic 2019 baselines. [1]
- Daily average in 2023: 112 people killed and approximately 6,692 injured every single day. [5]
The True Economic Cost
NHTSA calculated the total societal harm from motor vehicle crashes at $1.4 trillion in 2019, including property damage, medical costs, lost productivity, and the economic value of lives lost. [2] Adjusted for inflation to 2025, that figure rises to approximately $1.77 trillion. [2] Direct economic costs: excluding pain, suffering, and lost quality of life: reached $340 billion in 2019, or $429 billion in 2025 dollars. [2]
What the $1.77 Trillion Includes
- Medical and emergency response costs
- Lost wages and future earning capacity
- Property damage and vehicle replacement
- Legal and insurance system costs
- Lost quality of life and pain and suffering valuations
- Emergency services and law enforcement response
Section 2: Speed: The No. 1 Cause of Fatal Crashes
Speeding Kills 33 People Every Day
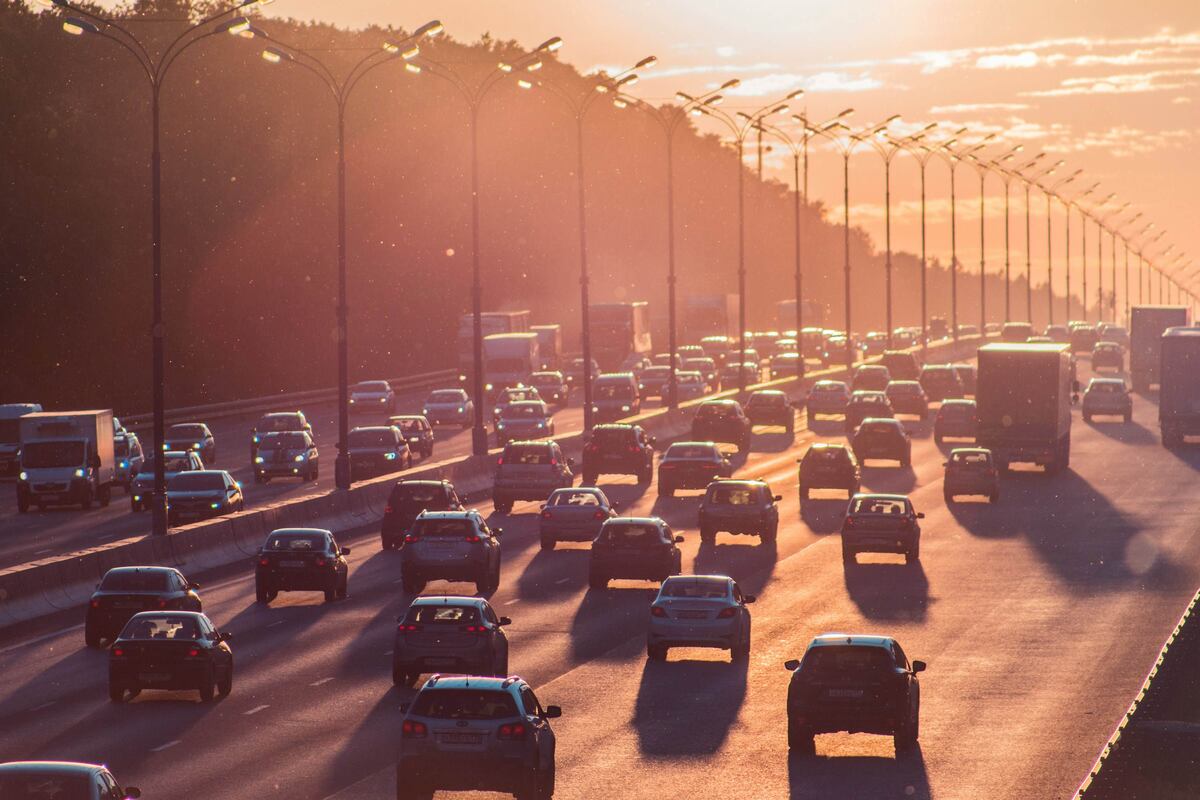
Speeding was a contributing factor in 29% of all traffic fatalities in 2023: 12,151 deaths across the United States. [3] That averages to 33 deaths every day attributable to a driver traveling too fast for conditions or above the posted limit. Speeding has consistently been the leading behavioral cause of fatal crashes for more than two decades of NHTSA data.
What Counts as Speeding
- Exceeding the posted speed limit on any road type
- Driving too fast for weather, visibility, or road surface conditions
- Racing another vehicle
- Driving at unsafe speeds through work zones or school zones
Speed and Crash Severity Are Directly Linked
The relationship between vehicle speed and crash outcome is not linear: it is exponential. California's speed camera pilot program under AB 645, launched in San Francisco in August 2025, is built on research showing that speed management is the single most effective lever for reducing serious injuries and deaths. [6]
Speed's Effect on Crash Outcomes
- A pedestrian struck at 20 mph has roughly a 5% chance of death
- At 30 mph, that probability rises to approximately 45%
- At 40 mph, the probability of a pedestrian fatality exceeds 85%
- Vehicle occupant fatality rates follow a similar curve as impact speed rises
Post-Pandemic Speeding Surge
Speeding violations surged significantly following the pandemic. Major speeding violations are up 55.5% compared to 2019 pre-pandemic baselines, while minor speeding violations have increased by 31.2%. [7] Despite a modest 1.2% increase in total vehicle miles traveled, violations climbed sharply: meaning more drivers are choosing to speed on the same roads, not simply driving more. [7]
Speed Enforcement and Camera Pilots
- San Francisco: 33 automated speed cameras active as of August 5, 2025 [6]
- Oakland: up to 18 cameras planned for late 2025 [6]
- Los Angeles: camera rollout targeted for 2026 [6]
- Glendale: included in AB 645 authorized cities alongside Avian Law Group's primary service area [6]
Section 3: Impairment: Still Killing 37 People Every Day
Alcohol-Impaired Driving by the Numbers
Alcohol-impaired driving killed 13,524 people in 2022: representing 32% of all U.S. traffic fatalities that year and one death every 39 minutes. [4] Alcohol-impaired driving is the single largest categorical contributor to traffic deaths, accounting for nearly one-third of all road fatalities despite decades of public awareness campaigns, tougher DUI laws, and ignition interlock requirements.
Alcohol Impairment Statistics at a Glance
- 13,524 alcohol-impaired driving deaths in 2022: 32% of all traffic fatalities [4]
- 37 people killed in drunk driving crashes every day [4]
- Drivers with BAC above 0.10 are 7 times more likely to cause a fatal crash than sober drivers [4]
- 31% of all traffic-related deaths involved alcohol impairment [4]
Drug Impairment Is Growing
Alcohol is not the only impairment risk. NHTSA data shows drug involvement in fatal crashes is increasing, driven in part by cannabis legalization in California, Nevada, and other western states, as well as growing prescription opioid use. [5] Drug-impaired driving is significantly underreported because roadside drug testing is less standardized than breath alcohol testing, meaning official statistics likely undercount the true impact.
Post-Pandemic Impairment Spike
DUI violations have climbed sharply since 2019. Older drivers aged 66-90 saw the largest year-over-year DUI increase at 19%, and a 44.8% increase compared to pre-pandemic 2019 baselines. [7] Drivers aged 36-45 posted a 27.4% DUI increase against 2019 levels. [7] These trends suggest impaired driving is not concentrated in any single demographic, but is broadly distributed across the driving population.
Who Is Most at Risk
- Drivers aged 21-34: historically the highest DUI crash involvement group
- Drivers aged 66-90: fastest-growing DUI violation rate since 2019 [7]
- Late-night and weekend driving: impairment crashes are heavily concentrated between 9 PM and 3 AM
- Rural roads: disproportionate share of fatal impairment crashes due to higher speeds and less lighting
Legal BAC Limits and Their Limits
All three states where Avian Law Group operates define legal impairment at a BAC of 0.08% for drivers over 21 and 0.01% to 0.04% for drivers under 21 and commercial vehicle operators. However, NHTSA research shows measurable driving impairment begins at BAC levels well below the legal limit: meaning some drivers involved in crashes are technically sober under the law but functionally impaired.
Section 4: California, Arizona, and Nevada: The Regional Picture
California: Volume Leader With Improving Fatality Rate
California recorded 164,123 total car crashes in 2024, resulting in 3,807 fatalities: a 6.3% decrease from the prior year and the lowest fatality count since 2019. [6] Despite the improvement, the state averages 1,370 crashes per day and remains the highest-volume crash state in the country. [6] Los Angeles County alone recorded 11,120 crashes in 2024. [6]
California Key Stats
- 164,123 total crashes in 2024 [6]
- 3,807 fatalities in 2024: down 6.3% year-over-year [6]
- 1,370 crashes per day on average [6]
- 12,085 pedestrian casualties in 2024-2025 [6]
- 9,852 cyclist injuries in 2024-2025 [6]
- Preliminary NSC data: 49% decline in motor vehicle deaths through May 2025 vs. same period 2024 [6]
Arizona: Second-Highest Fatality Rate in the Nation
Arizona posted a fatality rate of 1.73 per 100 million vehicle miles traveled in 2023: the second-highest of any state in the country, behind only Mississippi. [5] The rate is significantly above the national average of 1.26 per 100 million VMT recorded for California in 2023. [5] Phoenix's rapid growth and high-speed desert highway network contribute to elevated crash severity across the state.
Nevada: Desert Roads and High-Speed Corridors
Nevada's geography: long straight highways, remote desert roads, and casino corridor traffic: creates distinct crash patterns. Nearly 50,000 incidents were recorded in Nevada in recent data. [8] The Las Vegas metro area generates a significant share of impairment-related crashes, driven by tourist alcohol consumption patterns and 24-hour entertainment districts where impaired pedestrians and drivers share compressed urban space.
Two-Year Statute of Limitations in All Three States
California, Arizona, and Nevada each impose a two-year statute of limitations on personal injury claims arising from car accidents. [8] The clock begins on the date of the crash. Missing that deadline eliminates the right to sue, regardless of injury severity or liability. Filing early preserves evidence, secures witness statements, and provides the maximum time to document long-term medical impacts: particularly important in cases involving traumatic brain injury, spinal damage, or ongoing pain.
Section 5: What Victims Are Owed After a Crash
Comparative Fault Does Not Bar Recovery
All three states where Avian Law Group operates apply comparative fault rules to car accident claims. A victim who is partially at fault can still recover damages: the recovery is reduced proportionally by their share of fault, but not eliminated. [8] A victim found 20% at fault for a crash caused primarily by a speeding or impaired driver can still recover 80% of their total damages.
Economic Damages
- Emergency room and hospitalization costs
- Surgical procedures, imaging, and specialist consultations
- Physical therapy and long-term rehabilitation
- Lost wages during recovery
- Future lost earning capacity if injuries cause permanent disability
- Vehicle repair or replacement
- Ongoing medical equipment, home modification, and care costs
Non-Economic Damages
- Pain and suffering
- Emotional distress and anxiety
- Loss of enjoyment of life
- Disfigurement and permanent scarring
- Loss of consortium for a spouse or partner
Wrongful Death Damages
When a speeding or impaired driver causes a fatal crash, surviving family members may pursue a wrongful death claim. [8] Recoverable damages include funeral and burial costs, medical expenses incurred before death, the victim's lost lifetime earnings, the loss of companionship and support, and in some cases punitive damages when the defendant's conduct was egregiously reckless.
How Avian Law Group Handles Car Accident Cases
Avian Law Group represents car accident victims across California, Arizona, and Nevada under a Zero Fee Guarantee: no fees are charged unless the firm wins. Attorneys investigate fault, document all injuries from date of crash through maximum medical improvement, negotiate with insurance carriers, and file suit when carriers undervalue or delay claims. The firm has recovered more than $2.2 billion in settlements on behalf of clients. [8]
Steps to Protect a Car Accident Claim
- Call police and ensure an official accident report is filed
- Seek medical evaluation immediately, even for injuries that seem minor
- Photograph the scene, all vehicle damage, and visible injuries
- Collect names, contact information, and insurance details from all drivers
- Do not give recorded statements to the other driver's insurance company before consulting an attorney
- Contact Avian Law Group within days of the crash: not weeks: to preserve evidence
Section 6: The Legal Trend: Bigger Verdicts, Tougher Standards
Jury Awards Are Growing
Car accident jury verdicts have increased significantly over the past five years, driven by inflation in medical costs, growing public awareness of long-term crash injuries, and juror willingness to hold at-fault drivers and their insurers fully accountable. The average jury award in serious injury cases has risen sharply in California, where juror demographics in urban counties tend to produce larger verdicts than rural counterparts. This trend increases both the value of settlements and the leverage attorneys hold during pre-trial negotiations.
Underinsured Motorist Coverage Gaps
A significant share of crash victims discover after the fact that the at-fault driver carries only minimum liability coverage: or no insurance at all. California's minimum liability limits of $15,000 per person and $30,000 per accident were increased to $30,000 and $60,000 respectively under new law, but these limits still fall far short of actual costs in serious injury cases. [6] Uninsured and underinsured motorist coverage through a victim's own policy becomes the primary recovery vehicle in these situations.
Why Minimum Limits Are Almost Always Insufficient
- A single emergency room visit and overnight hospital stay can exceed $30,000
- Spinal surgery commonly costs $80,000 to $150,000 or more
- Traumatic brain injury rehabilitation can run $1,000 per day or higher
- Lost wages in professional occupations can exceed policy limits within weeks
Speed Cameras Are Generating New Evidence
California's AB 645 speed camera program, now live in San Francisco and expanding to Oakland, Los Angeles, and Glendale, is beginning to generate new evidentiary tools for personal injury litigation. [6] Speed camera data can establish a driver's velocity at a specific location and time: critical evidence in crash liability disputes where the at-fault driver denies speeding. As the program expands, attorneys will increasingly be able to subpoena camera records to document pre-crash driving behavior.
Impaired Driving Exposes Defendants to Punitive Damages
In California and Arizona, when a defendant's conduct is found to constitute malice, oppression, or fraud: a standard that impaired driving can meet: courts may award punitive damages beyond compensatory recovery. [8] A DUI-related crash in which the defendant had a significantly elevated BAC, had prior DUI convictions, or was warned not to drive creates a strong punitive damages argument. These awards are not capped in California and can substantially increase total recovery for victims.
Conclusion
Speeding and impaired driving are not random acts of fate: they are choices that kill tens of thousands of Americans every year and cost the country nearly $1.77 trillion in total societal harm. [1][2] The 39,254 people who died in 2024 and the 2.42 million who were injured are not statistics: they are people with families, careers, and lives derailed or ended by preventable decisions made by other drivers. [1]
What Victims in California, Arizona, and Nevada Need to Remember
- Speeding caused 29% of all U.S. traffic fatalities in 2023: 33 deaths per day: and is the single most common behavioral cause of fatal crashes [3]
- Alcohol-impaired driving kills one person every 39 minutes and accounts for roughly one-third of all traffic deaths [4]
- Arizona has the second-highest traffic fatality rate in the country; California leads in total crash volume [5][6]
- Comparative fault rules allow recovery even when a victim shares partial responsibility: the award is reduced, not eliminated [8]
- Punitive damages are available in California and Arizona when impaired driving or extreme recklessness is proven [8]
- All three states impose a two-year statute of limitations: delaying legal consultation means risking the ability to recover anything [8]
Contact Avian Law Group
Avian Law Group represents car accident victims across California, Arizona, and Nevada under a Zero Fee Guarantee. There are no upfront costs. Fees are only collected when the firm wins. Call 888-465-0540 or visit avianlawgroup.com/car-accident-attorney for a free case evaluation.
Works Cited
- Advocates for Highway and Auto Safety. Media Statement on 2024 and 2025 Crash Data Released by NHTSA. saferoads.org. April 1, 2026. Used for 2024 final death count (39,254), 2.42M injuries, 2025 early estimate (36,640), 8% above 2019 baseline.
- NHTSA / Advocates for Highway and Auto Safety. The Economic and Societal Impact of Motor Vehicle Crashes, 2019 (Revised). DOT HS 813 403. December 2022. Used for $1.4 trillion total societal harm, $340 billion direct costs, $1.77 trillion and $429 billion 2025-adjusted figures.
- NHTSA National Center for Statistics and Analysis. Summary of Motor Vehicle Traffic Crashes: 2023 Data. Traffic Safety Facts Report No. DOT HS 813 762. October 2025. Used for speeding fatality count (12,151), 29% of all fatalities, 33 deaths per day average.
- NHTSA Traffic Safety Marketing. Distracted Driving and Impaired Driving Facts. trafficsafetymarketing.gov. 2024-2025. Used for alcohol-impaired fatality count (13,524 in 2022), 32% share of all fatalities, one death every 39 minutes, 37 deaths per day, BAC 0.10 risk multiplier.
- NHTSA National Center for Statistics and Analysis. Summary of Motor Vehicle Traffic Crashes: 2023 Data (state fatality rates). DOT HS 813 762. October 2025. Used for Arizona 1.73 rate (2nd highest nationally), California 1.26 rate, national decade comparison showing 25% increase 2014-2023.
- Blair Ramirez Law / California Office of Traffic Safety / LADOT / AB 645. California Car Accident Statistics 2025. blairramirezlaw.com. February 2026. Used for 164,123 crashes, 3,807 fatalities, 1,370 crashes/day, 11,120 LA County crashes, pedestrian/cyclist figures, NSC 49% decline, speed camera rollout status by city.
- LexisNexis / Repairer Driven News. New Data Shows Distracted Driving Up 68.8%. repairerdrivennews.com. August 2025. Used for post-pandemic speeding violation increase (55.5% major, 31.2% minor vs. 2019), DUI increases by age group (66-90 up 44.8%, 36-45 up 27.4% vs. 2019).
- Avian Law Group / Expert Car Accident Lawyers. avianlawgroup.com. Used for CA/AZ/NV two-year statute of limitations, comparative fault rules, $2.2 billion recovered in settlements, wrongful death damages framework, minimum liability coverage limits under new California law, punitive damages standard.
- Hillstone Law. California Car Accident Statistics and Trends in 2025. hillstonelaw.com. September 2025. Used for 2023 California fatality rate (1.26), NHTSA 2024 fatality rate (1.20 per 100M VMT, lowest since 2019), AB 645 speed camera program details and authorized cities.
- Avian Law Group. Expert Car Accident Lawyers. avianlawgroup.com. Used for Nevada incident volume (~50,000), CA/AZ/NV state-specific fatality totals, comparative negligence framework across all three states.

Michael Avanesian, the founder and driving force behind Avian Law Group, is a passionate and dedicated attorney with a strong background in personal injury law. As a partner at JT Legal Group, Michael led the growth of the personal injury practice from a single employee to a team of over ninety professionals, securing over $2 billion in settlements for clients in just three years.