Navigating Safety:
The ridesharing industry has evolved rapidly over the last few years to reshape urban mobility by offering a viable alternative to traditional transportation methods. This report presents a comprehensive analysis of rideshare accident statistics in 2024, highlighting key trends and implications within the industry. The objective is to examine the frequency, causes, and outcomes of ride-sharing-related accidents.
We will focus on understanding the dynamics of these incidents, their impact on passengers, drivers, and public safety, and measures to mitigate risks. The report aims to provide a detailed perspective on the safety challenges faced by the ridesharing industry and the effectiveness of current strategies in enhancing road safety in this evolving landscape.
The ridesharing market has experienced significant evolution, both in the US and globally.

In 2022, the global ridesharing market reached a valuation of $95.8 billion. Uber and Lyft dominate the US market market, with Uber holding a significant majority of the market share compared to Lyft.
Ridesharing services see widespread usage across various demographics. Notably, urban residents with higher incomes and college degrees represent a significant portion of this user base. This trend highlights the service’s popularity among younger, affluent city dwellers.
Uber and Lyft, the two giants in the field, show differing financial performances and market strategies. While Uber’s revenue surpassed Lyft’s in 2021, Lyft’s market approach varies significantly from Uber’s. Uber’s diverse services, including deliveries and freight, generate higher revenues than Lyft in North America.
According to a study by the US National Bureau of Economic Research, there has been a 3% annual increase in vehicular deaths linked to the prevalence of rideshare services. This translates to approximately 987 additional roadway deaths each year attributed to the presence of Uber and Lyft drivers. This increase is associated with the high volume of drivers these services need to ensure quick response times for consumers.
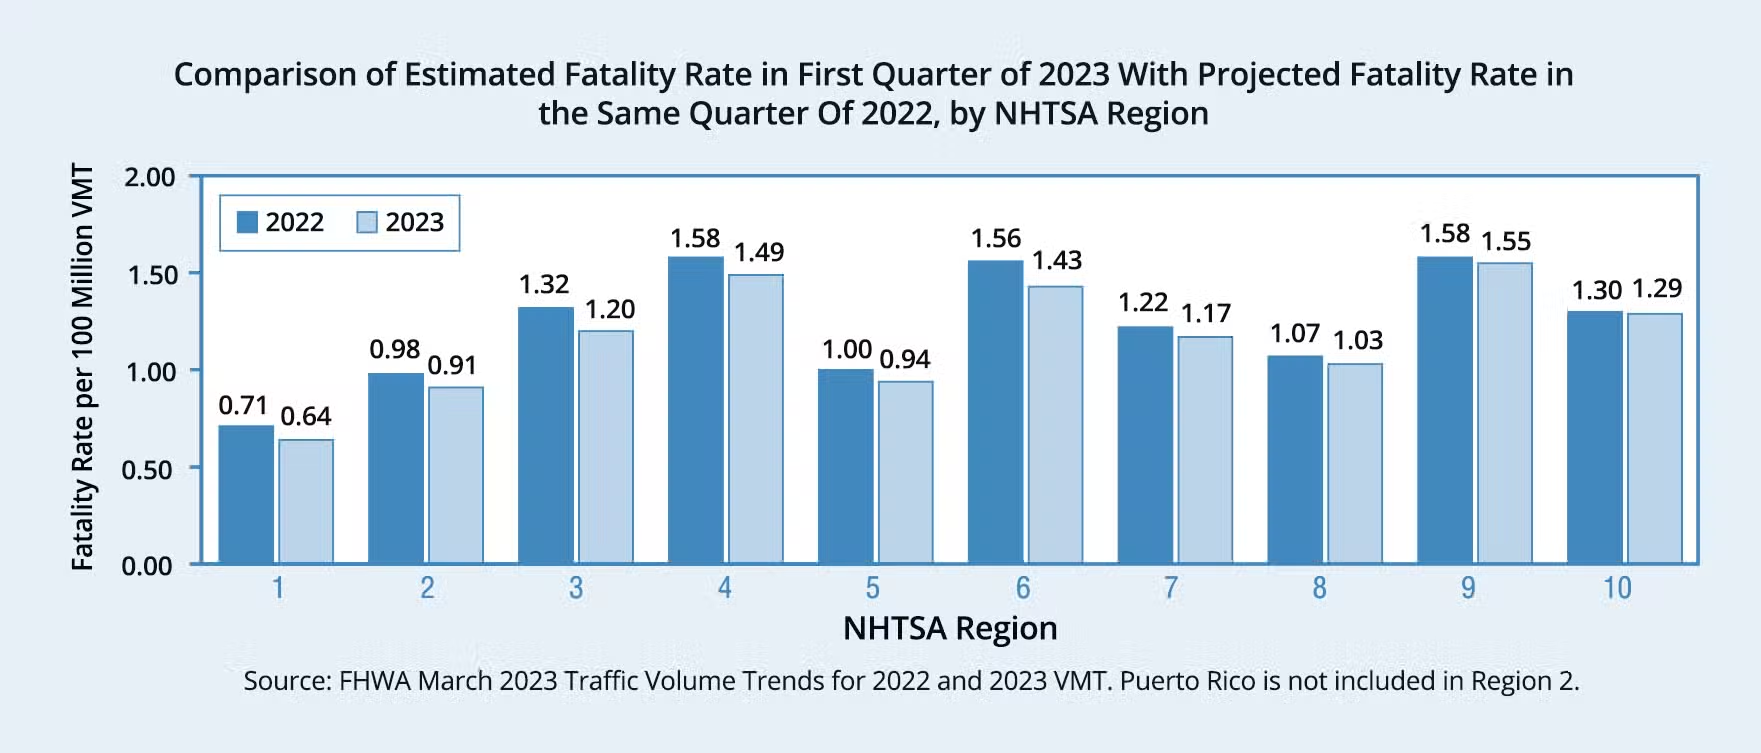
The latest statistics on traffic fatalities in the US, including those related to ridesharing services like Uber and Lyft, indicate improvements and ongoing road safety challenges. In the first half of 2023, for instance, there was a noticeable decrease in traffic fatalities. The National Highway Traffic Safety Administration (NHTSA) estimated about 19,515 deaths in motor vehicle traffic crashes in the first six months, representing a reduction of approximately 3.3% compared to the same period in 2022. Similarly, the National Safety Council (NSC) reported 21,130 motor vehicle deaths during the same period, a decrease of 3% from 2022.
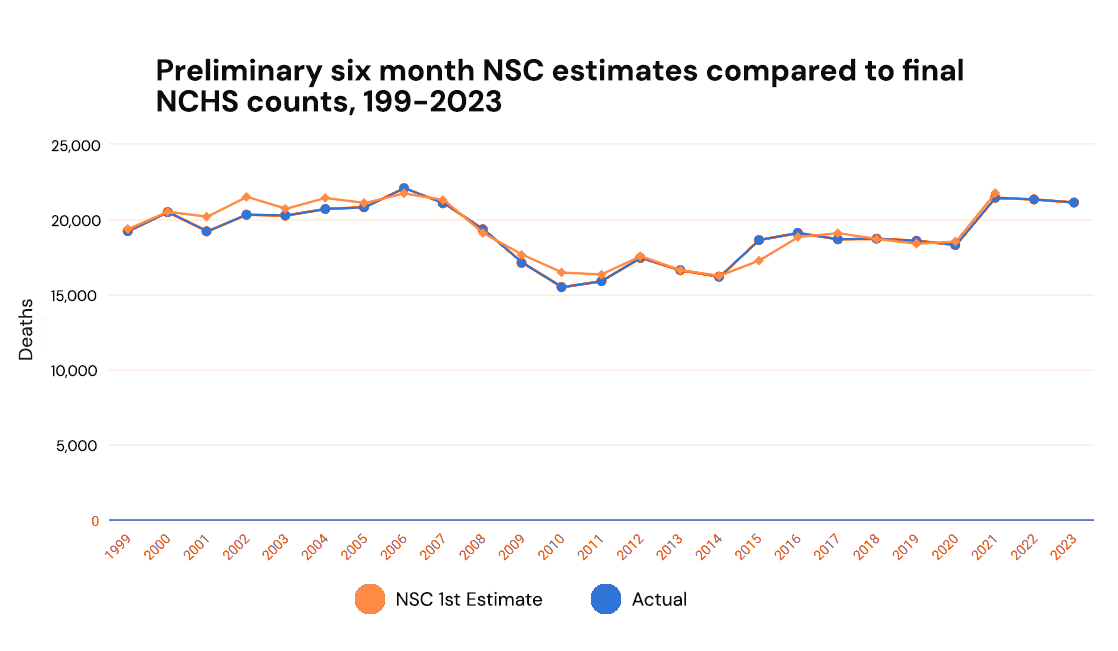
These statistics also show a slight decrease in the monthly mileage death rate. For example, in August 2023, the preliminary estimate of traffic-related deaths was 4,040, which remained stable compared to 2022 but marked a 6% decrease from 2021.
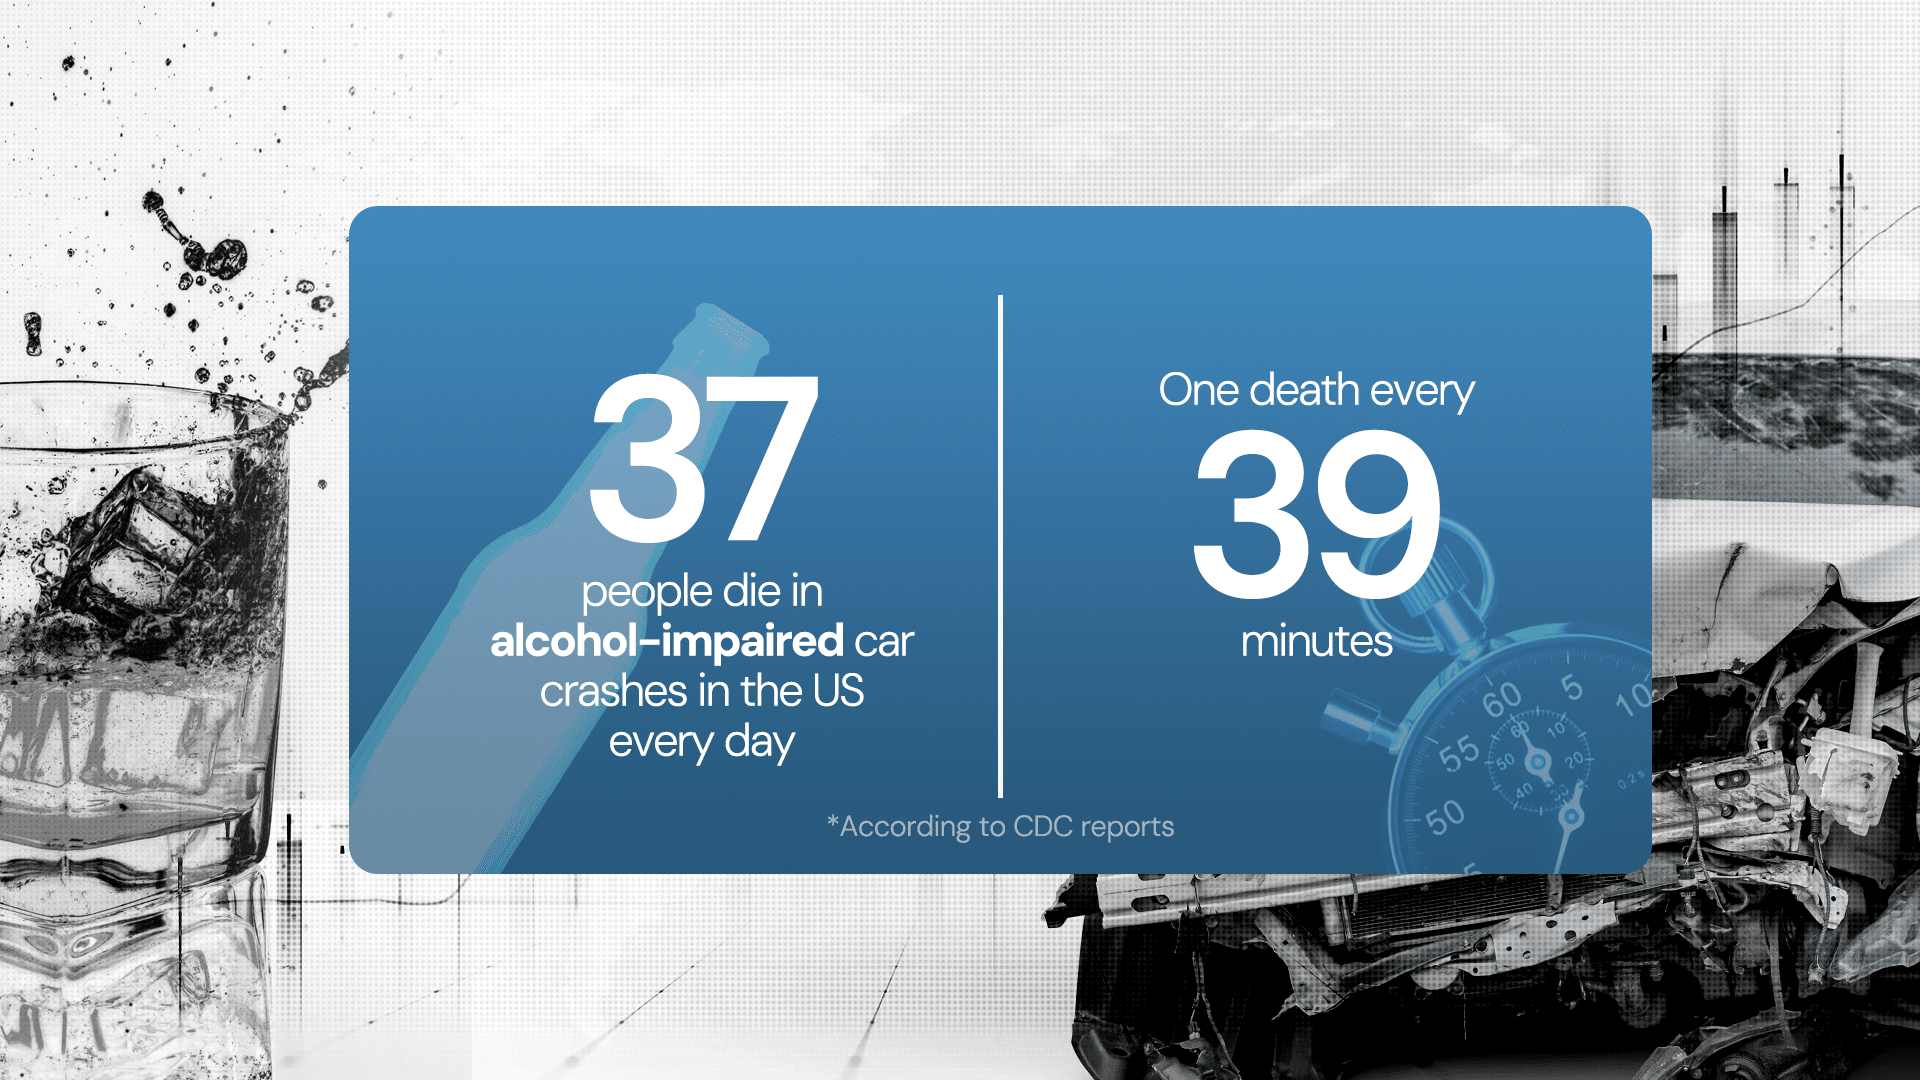
Ridesharing services have significantly impacted alcohol-related traffic fatalities. According to the National Bureau of Economic Research, ridesharing has reduced US traffic deaths related to alcohol by 6.1% and overall traffic fatalities by 4%. The CDC reports that currently, 37 people die in alcohol-impaired car crashes in the US every day, amounting to one death every 39 minutes. Notably, drivers with a Blood Alcohol Content over 0.10 are seven times more likely to be involved in fatal accidents than sober drivers.
Rideshare vehicles are not immune to traffic fatalities. Between 2017 and 2018, Uber cars were involved in nearly 110 accident-related deaths across 97 fatal crashes. In these incidents, riders and drivers each accounted for 21% of the fatalities, with the remaining victims being third parties.
Ridesharing has reshaped transportation, particularly in urban areas. It provides an accessible, on-demand transportation option, impacting public transport usage. During the COVID-19 pandemic, public transportation trips in the US decreased by 53%, while Uber trips only declined by 27%.
This shift indicates a growing preference for ridesharing over traditional public transportation, which may have long-term implications for urban planning and traffic dynamics.

In 2019, the statistics for safety incidents in ridesharing apps Uber and Lyft revealed a low incidence rate, yet some differences between the two companies are notable. For Uber, motor vehicle fatalities constituted 0.000005% of all trips, slightly lower than Lyft’s 0.000006%. Physical assault fatalities were exceedingly rare in both, with Uber at 0.000001% and Lyft even lower at 0.0000005%.

The total incidents, combining all safety issues, were 0.0003% for Uber trips and 0.0005% for Lyft trips. Lyft had a higher rate of incidents in nearly all categories except physical assault, whereas Uber’s rate was 46% higher. The most common safety incident for both companies in 2019 was sexual assault, with Lyft reporting notably more incidents than Uber, especially in the category of non-consensual kissing of a non-sexual body part.
Here’s how rideshare accident statistics break down into demographics.
Uber reports that 0.000005% of all their trips in 2019 involved a motor vehicle fatality.
More than 99.9% of all Uber and Lyft trips occur without safety incidents.
Both Uber and Lyft have minimal incident rates. More than 99.9% of trips with these services occur without safety incidents, according to the companies.
While rare, risks include motor vehicle accidents, physical assaults, and, in sporadic cases, sexual assaults. For Uber, 0.000005% of trips in 2019 involved a motor vehicle fatality, and 0.0001% involved a sexual assault.