
Need a skilled personal injury attorney in Glendale, CA?
Choosing the right personal injury attorney in Glendale, CA, can make a vital difference in the outcome of your case. At Avian Law Group, a dedicated personal injury law firm, we are committed to ensuring that you receive the compensation you deserve for your injuries.
Get a FREE case evaluation today.
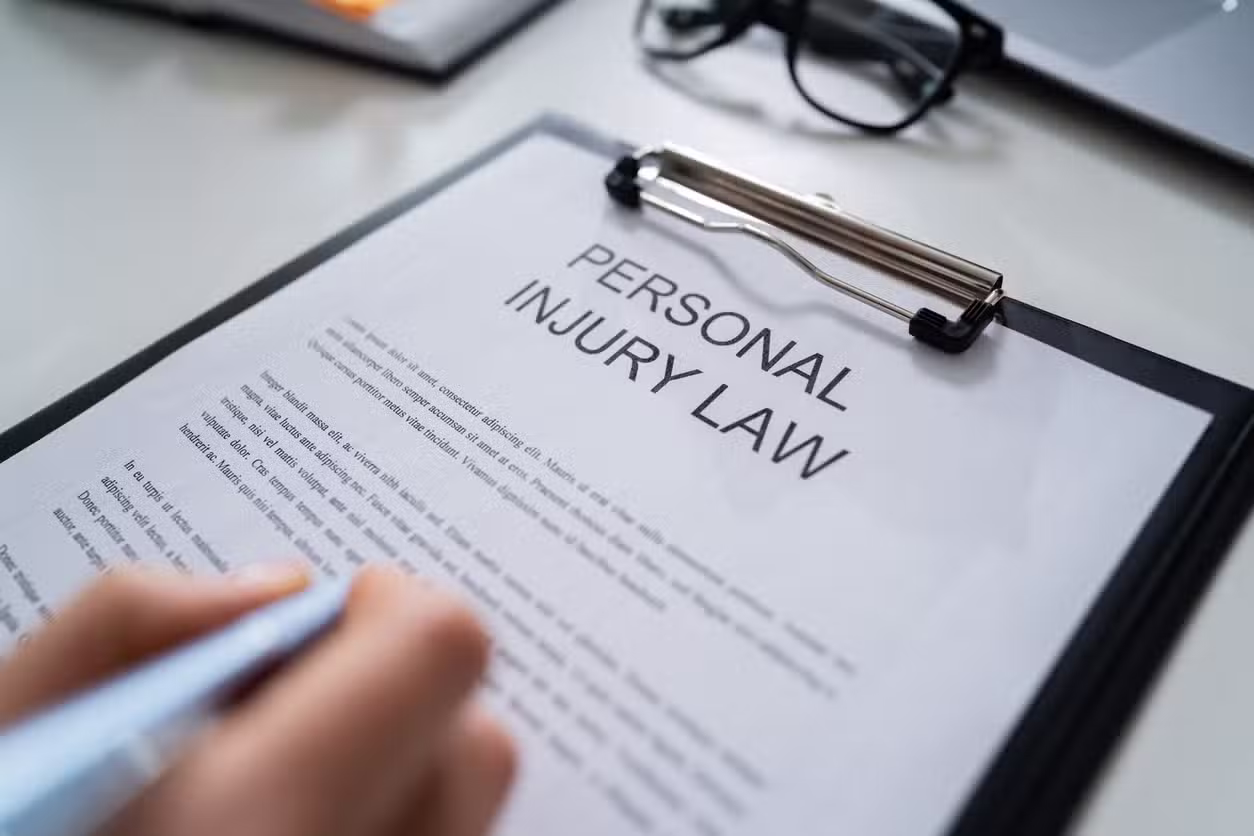
Finding the Right Personal Injury Attorney in Glendale, CA
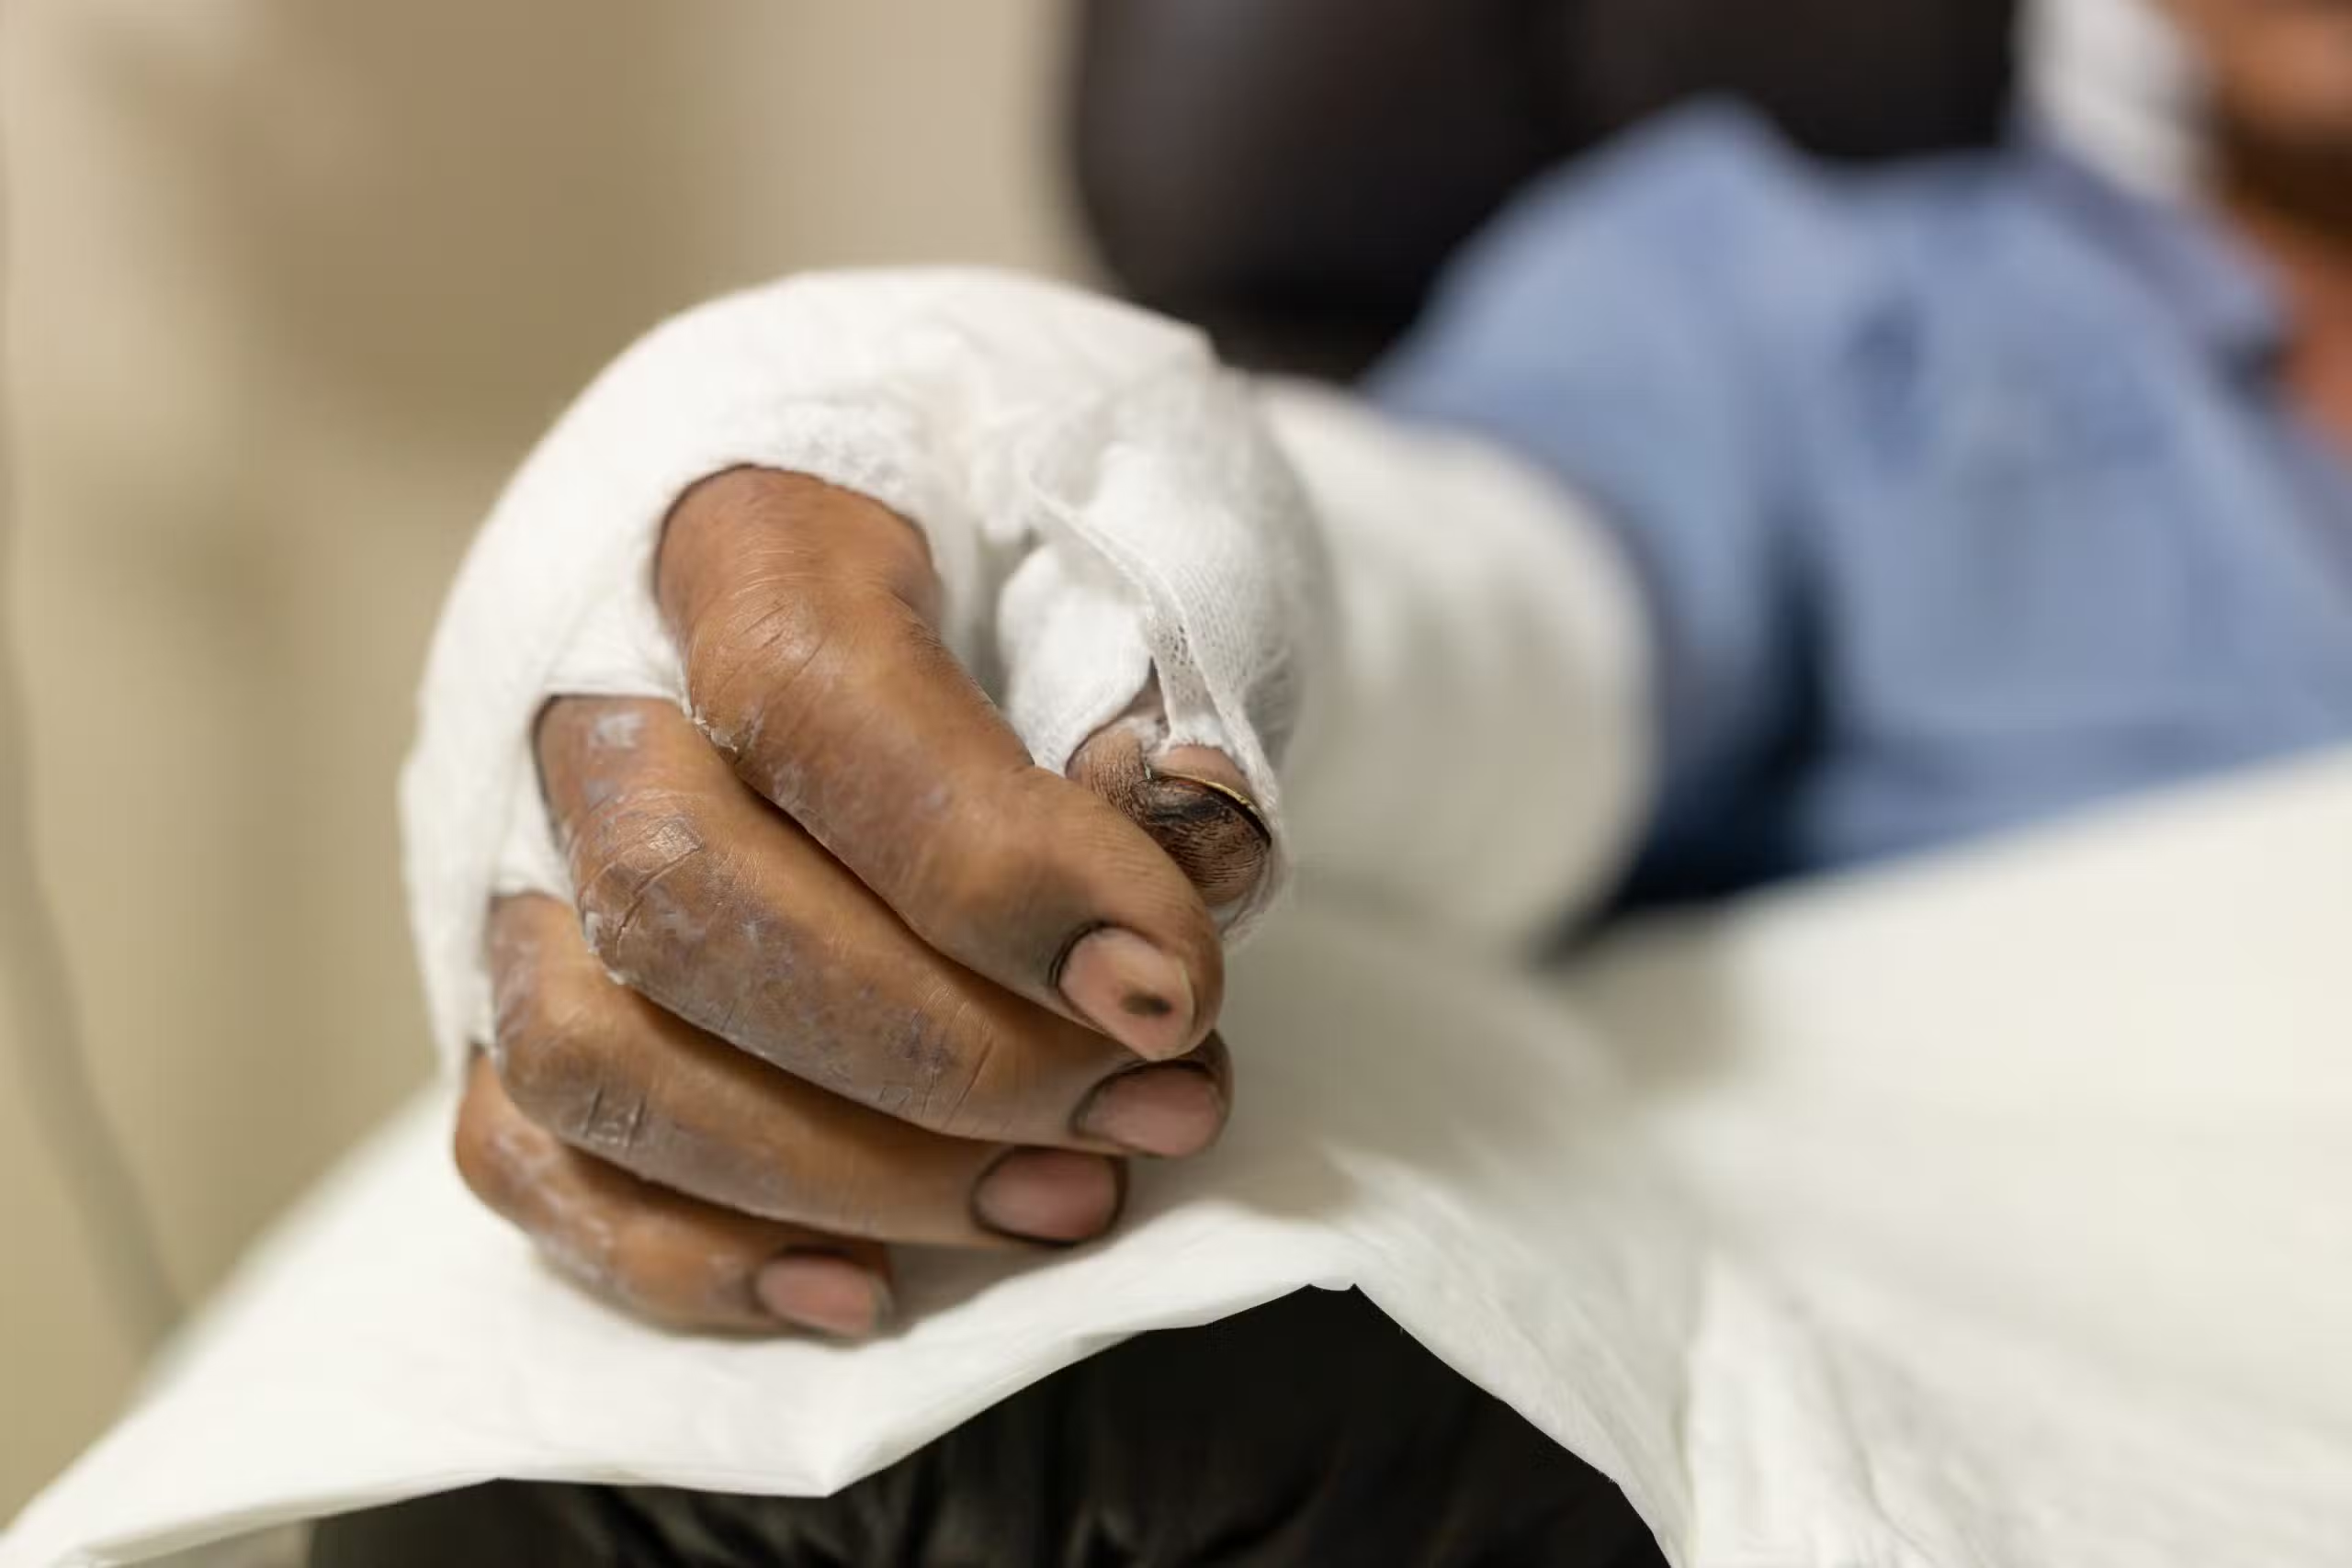
If you have been injured due to someone else's negligence in Glendale, CA, seeking legal representation from a personal injury attorney is crucial. At Avian Law Group, we specialize in helping victims secure compensation for their injuries, medical expenses, and lost wages, ensuring they receive the justice they deserve.

Comprehensive Legal Services Offered
Avian Law Group provides a wide array of legal services tailored to personal injury cases. Our experienced attorneys focus on various types of claims, including but not limited to car accidents, slip and fall incidents, workplace injuries, and product liability. We understand the nuances of personal injury law in California and are dedicated to obtaining favorable outcomes for our clients.
Car Accident Cases
Car accidents are unfortunately common in Glendale, and our attorneys are well-versed in navigating these complex cases. We investigate the circumstances surrounding the accident, gather evidence, and build a strong case to support your claim.
Medical Malpractice Claims
- Expert Evaluation: We consult with medical professionals to assess the validity of your claim.
- Thorough Investigations: We conduct comprehensive investigations to uncover the truth behind incidents of negligence.
- Negotiation Skills: Our team excels in negotiating fair settlements with insurance companies.
- Litigation Readiness: If necessary, we are prepared to take your case to court to fight for your rights.
Local Impact and Statistics
According to the California Highway Patrol, there were over 200 reported traffic collisions in Glendale in 2022 alone. Furthermore, personal injury claims in Los Angeles County have increased by 15% due to rising traffic volume and distracted driving. This underscores the importance of having legal representation to handle such cases effectively.
Why Choose Avian Law Group?
We're in this with you, and ready to get your case settled.
Proven Track Record
We have successfully represented numerous clients, securing millions in settlements.
Local Expertise
Our deep understanding of Glendale’s laws and regulations gives us an edge in your case.
Personalized Attention
We treat each case uniquely, ensuring our strategies align with your specific needs.
No Win, No Fee
Our contingency fee structure means you pay nothing unless we win your case.
Frequently Asked Questions
about Personal Injury Attorneys in Glendale, CA
If you or a loved one has suffered an injury in Glendale, CA, don’t navigate this complex process alone. Contact Avian Law Group today for a free consultation and let us help you secure the compensation you deserve.
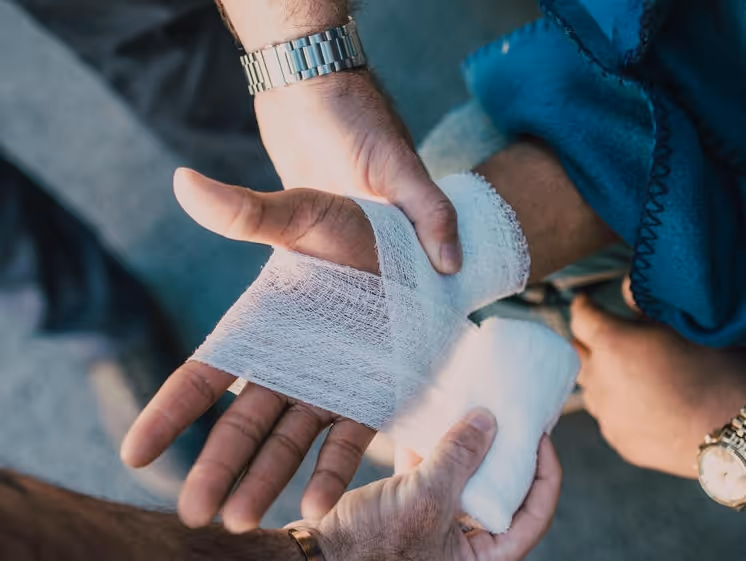
Immediately seek medical attention and document your injuries. Report the incident to the appropriate authorities and collect contact information from witnesses.
Most personal injury attorneys, including those at Avian Law Group, work on a contingency fee basis. This means you only pay if we win your case, making legal representation accessible.
In California, the statute of limitations for personal injury claims is generally two years from the date of the injury. It’s essential to act quickly to preserve your rights.
You may be entitled to recover medical expenses, lost wages, pain and suffering, and other damages directly related to your injury. The specifics of your case will determine the compensation available.
A local personal injury attorney understands the specific laws and court procedures in Glendale, which can significantly benefit your case. Their knowledge of local nuances can enhance your chances of a successful outcome.
Get Started for Free
We're in this with you, and ready to get your case settled.
.gif)
%20(1)%20(1)%20(1).gif)
.gif)
Get the Help You Need Today
If you or a loved one has been involved in a car accident, don’t hesitate to reach out for assistance.
Contact Avian Law Group today for a free consultation, where our experienced car accident lawyers will guide you through the claims process.
Get a FREE case evaluation today


.avif)