California Traffic Report
California’s roads are bustling and its traffic-related challenges are diverse. Millions navigate its vast highways every day in a mass movement that highlights the need for a clear understanding of the state’s traffic patterns and safety stats.
In this report, we dive into what’s happening on California’s roads – from accident rates to traffic congestion – and evaluate the effectiveness of current safety measures. We aim to shed light on challenges facing both motorists and policymakers and suggest ways to make our roads safer.
California Traffic Patterns
Like most places, California sees peak traffic during morning and evening rush hours. This is especially evident in metropolitan areas like Los Angeles and San Francisco. These periods see a significant increase in traffic density, particularly on major arteries such as the I-5, I-405, and US-101, which are notorious for congestion.
Major highways connecting urban centers to suburban areas, like the I-10 and the I-80, also experience high levels of traffic, particularly near entry and exit ramps in densely populated regions. The San Francisco Bay Area’s I-680 and Silicon Valley’s US-101 corridor also frequently report some of the highest congestion rates statewide.
Recent years have also seen fluctuations in this traffic volume. This was mainly influenced by factors like population growth – which increased by around 6% over the past decade, and urban expansion into previously less dense areas.
The rise of remote working arrangements has also shifted traditional traffic patterns, particularly in tech-heavy regions. It has led to some decrease in congestion during what were once peak hours.
Despite that, overall vehicle usage during mid-day and weekends is still high as people adapt to more flexible work environments.
Traffic Accident Statistics
As one of the busiest states in the US, California saw approximately 14.3 million new automobile registrations in 2021 alone, the highest in the nation. With nearly 31.4 million motor vehicles registered overall, the state’s roads are some of the most frequented in the country. This contributes to its complex traffic safety landscape.
According to the latest report by the California Office of Traffic Safety (OTS), traffic fatalities climbed to 4,285 in 2021, marking a 7.6% increase from 2020.
Accidents in California stem from various causes, with alcohol impairment and speeding being significant contributors.
Alcohol-impaired driving fatalities surged by 16% to 1,370 in 2021, up from 1,180 in 2020. Speeding-related incidents, likewise, continue to represent a major portion of traffic accidents in California.

Compared to alcohol, drug-impaired driving showed a slight decrease. 52.9% of drivers killed in crashes across the state tested positive for legal or illegal drugs in 2021, down 5.5% from the previous year.
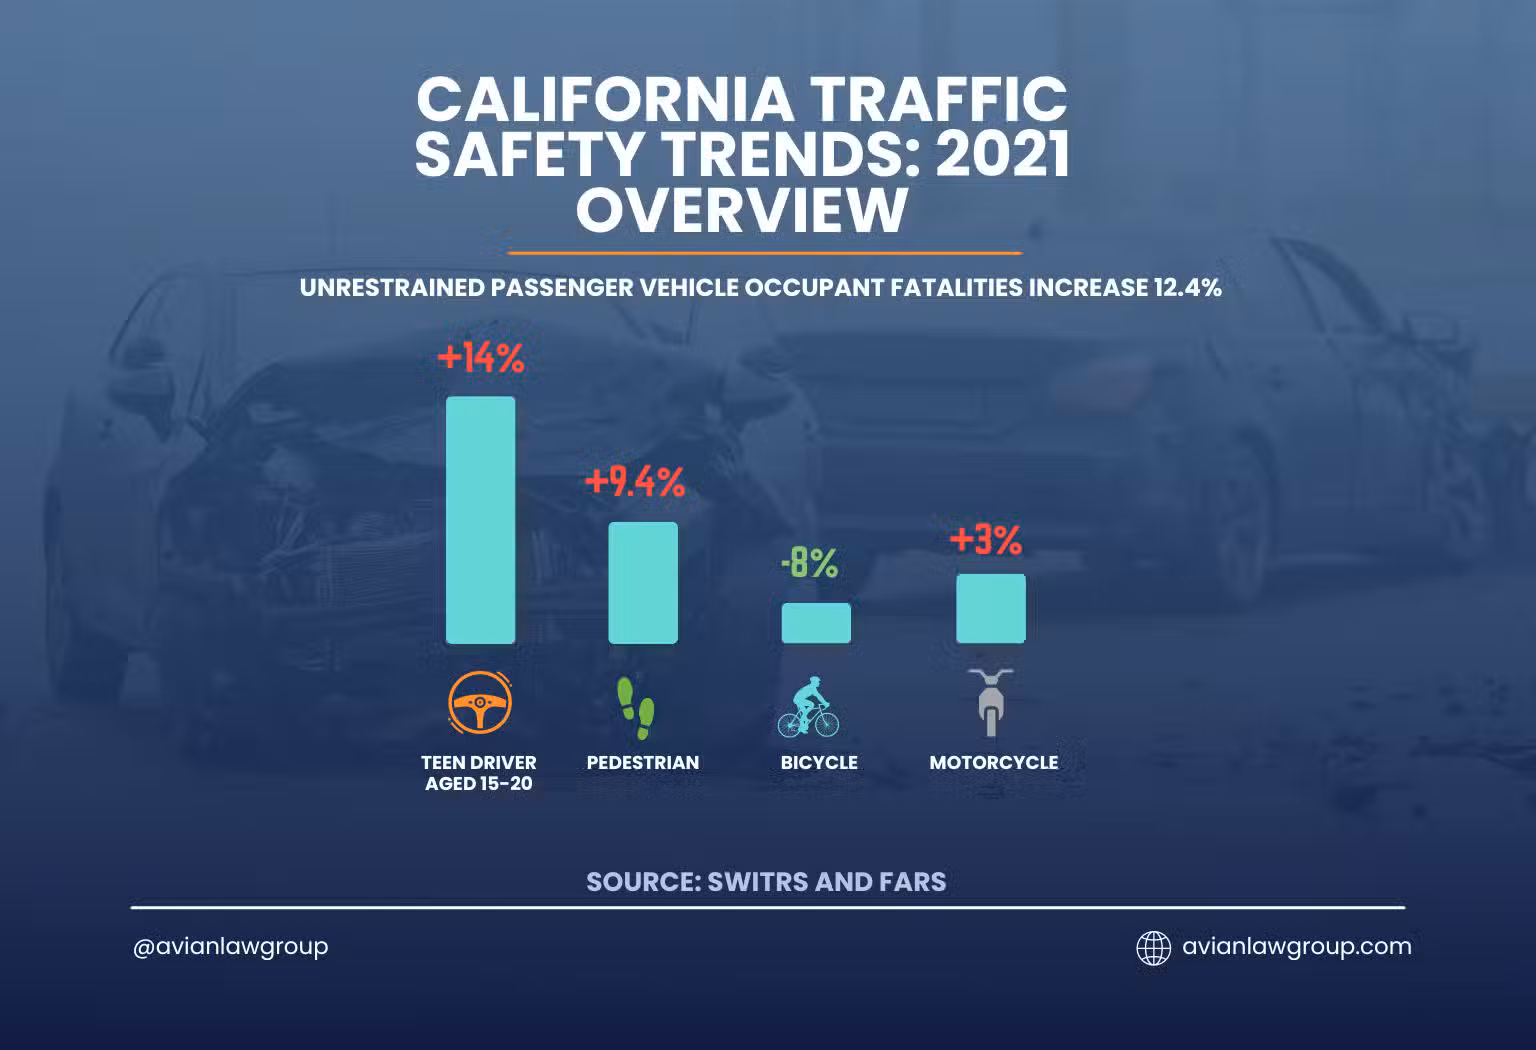
Incidents related to passengers not wearing seat belts have worsened, however, with unrestrained passenger vehicle occupant fatalities rising by 12.4%, from 782 in 2020 to 878 in 2021.
Motorcycle safety also remains a concern, with fatalities increasing by 3% year-over-year and incidents involving unhelmeted riders rising by 9%.
Among teens, drivers aged 15-20 involved in fatal crashes increased by 14.8%. This also highlights the need for enhanced driving education and safety measures for young drivers.
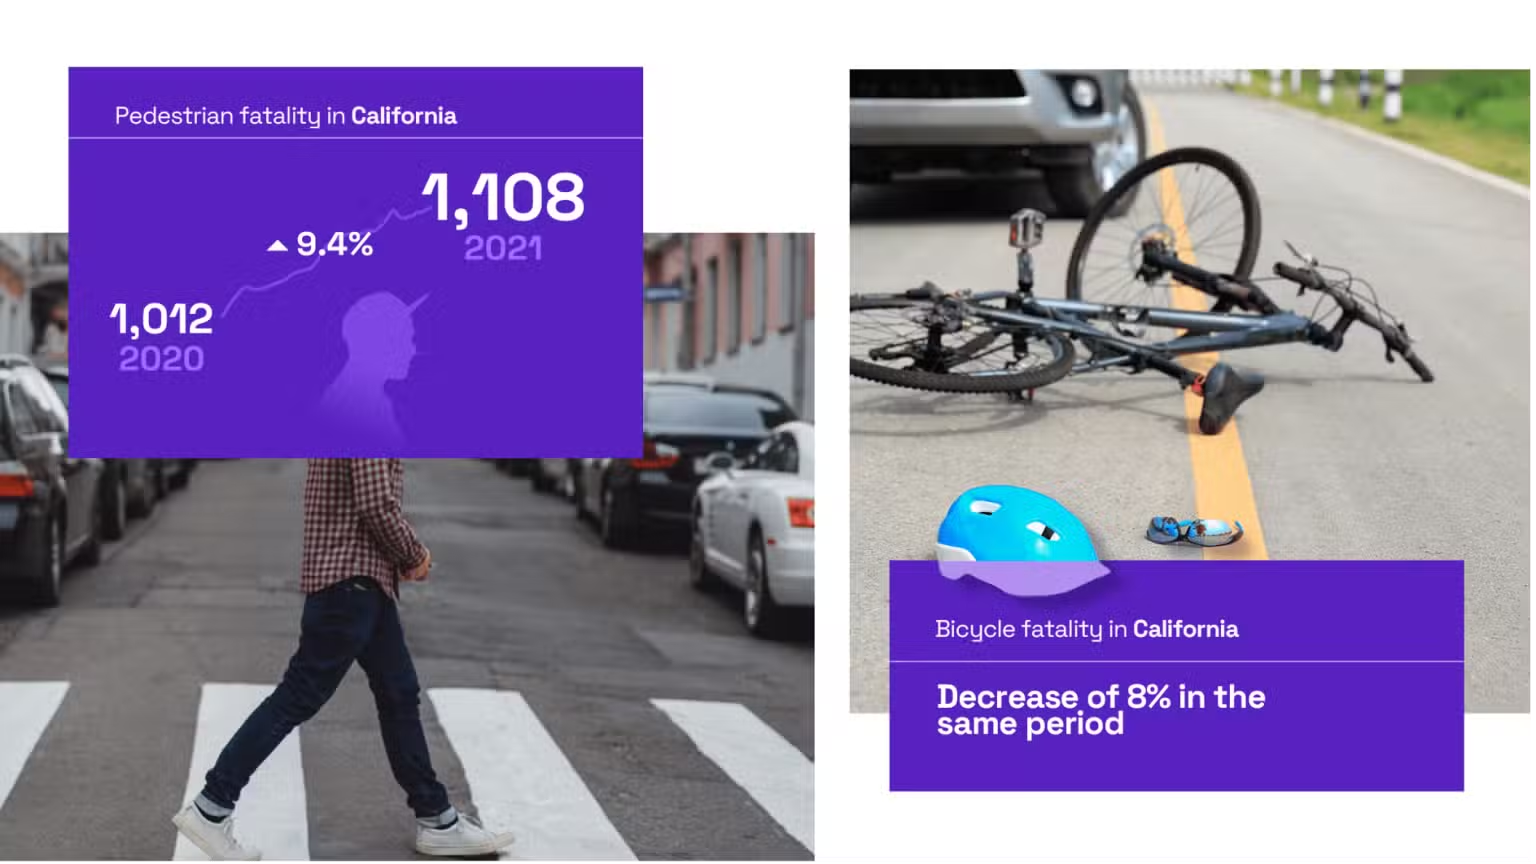
Pedestrian safety is another area of concern in California, with fatalities rising to 1,108 in 2021, up 9.4% over the preceding year. Conversely, bicycle fatalities saw a decrease of 8% in the same period, indicating some progress in bicycle safety initiatives.
Most of the above statistics are drawn from the Statewide Integrated Traffic Records System (SWITRS) and the Fatality Analysis Reporting System (FARS). They highlight the multifaceted challenges facing California’s traffic safety and the ongoing need for interventions.
High-Risk Areas and Times
California’s diverse geography and extensive urban sprawl play a significant part in accident rates across the state. For instance, regions with the highest accident rates typically include densely populated areas like Los Angeles County and the San Francisco Bay Area, along with transportation hubs around San Diego and Sacramento.
These areas combine high traffic volumes with complex road networks, which significantly increases the potential for accidents.
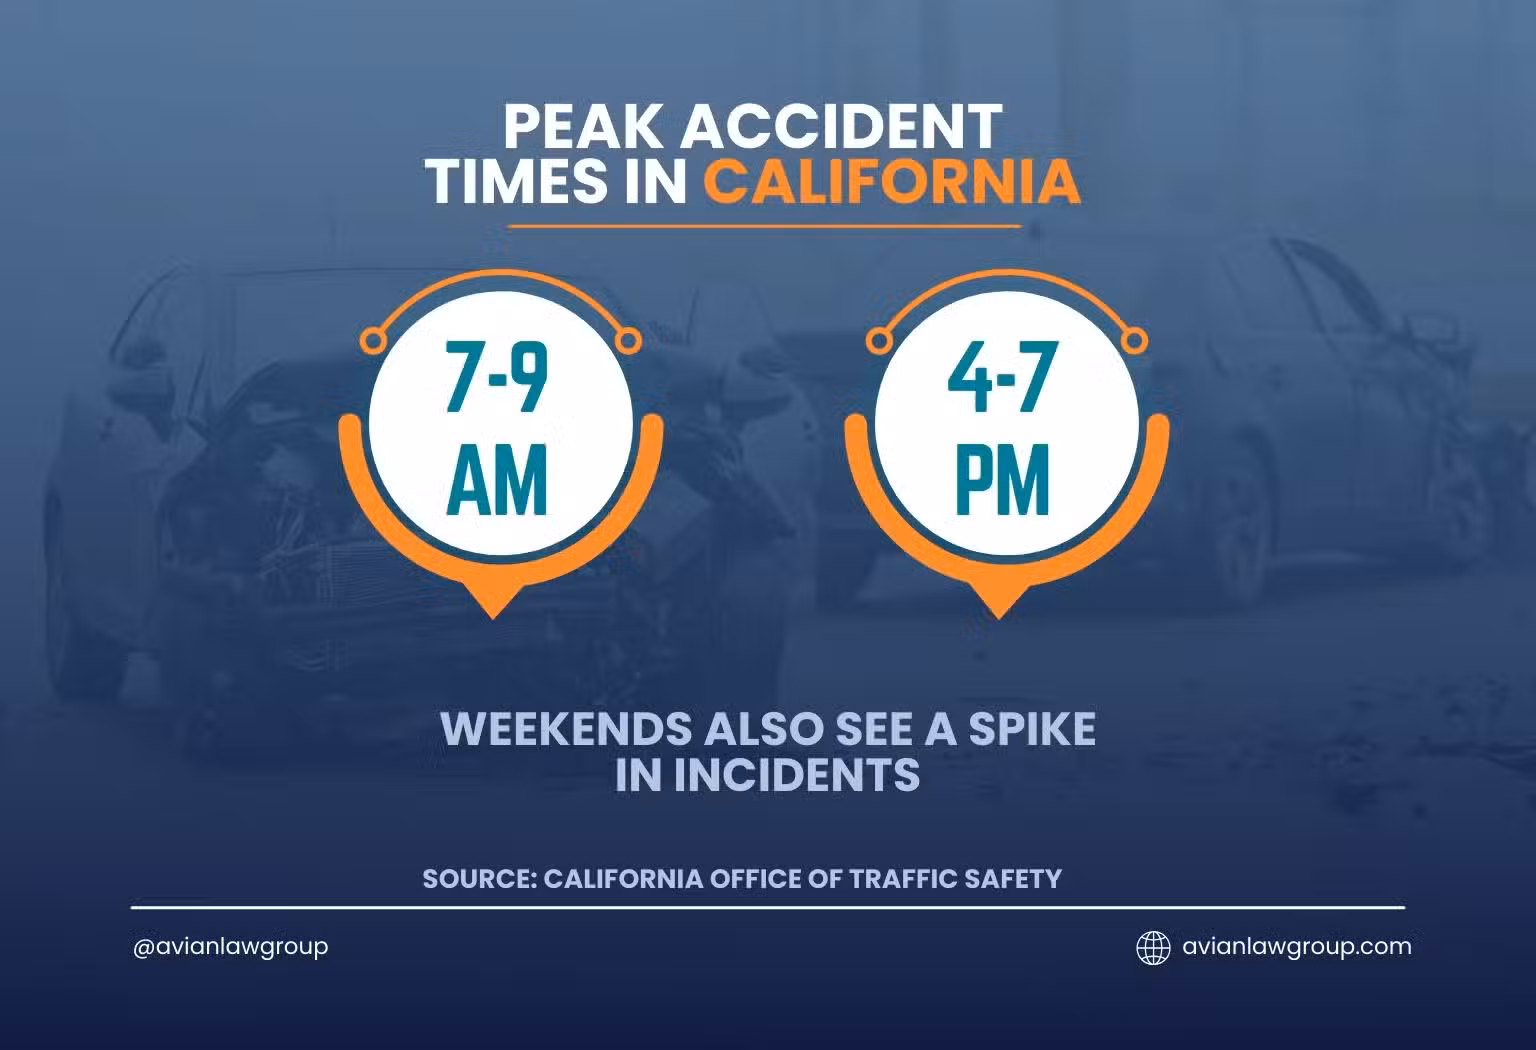
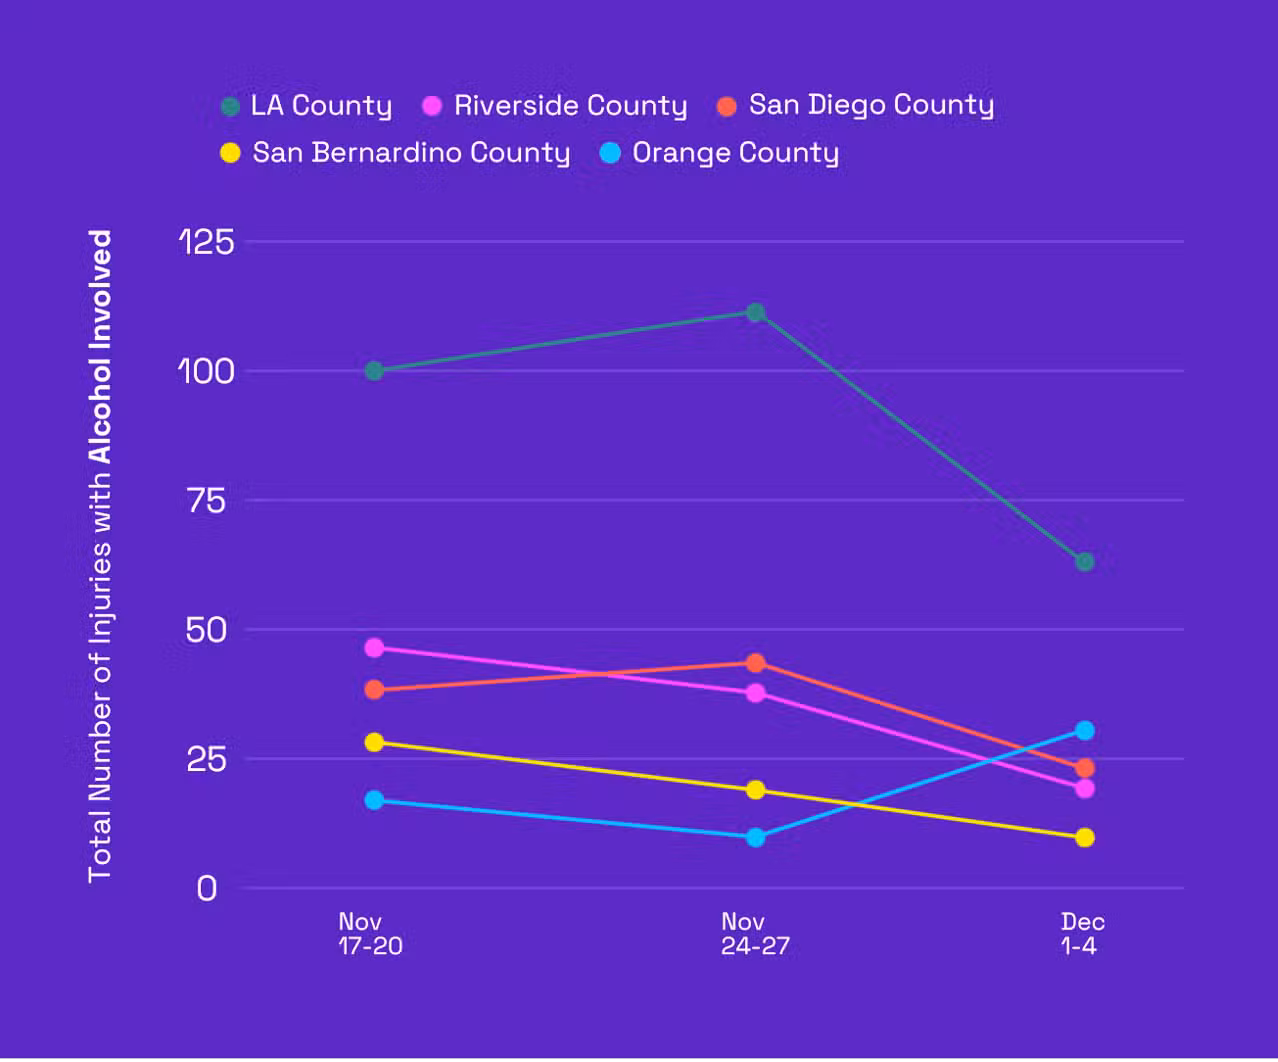
Accident frequency peaks during rush hours, from 7-9 AM and 4-7 PM, coinciding with the daily commute when roads are most congested. Weekends also see a spike in incidents, particularly late at night, when alcohol-related accidents are more common. These incidents are in keeping with national trends that show weekend vulnerabilities in traffic safety.
Seasonal variations also play a significant role in accident dynamics. Accident rates tend to rise during the summer months and the December holiday season. Summer travel increases overall vehicle miles, while holiday festivities contribute to higher incidences of impaired driving.
These seasonal patterns underline the need for heightened awareness and enhanced enforcement efforts during such periods.
Impact of Road Conditions and Infrastructure
Road conditions are significant contributors to traffic accidents in California. Poorly maintained roads with potholes, uneven surfaces, and faded or absent road markings directly contribute to numerous traffic incidents each year.
Inadequate signage and poorly designed road intersections further complicate navigation and increase the likelihood of accidents. This is usually more evident in areas outside of major urban centers where maintenance may be lacking.
Infrastructure projects have a dual impact on California’s traffic safety patterns. While long-term projects aim to enhance road safety and efficiency, the short-term effects often include increased congestion and heightened accident risks due to narrowed lanes, temporary signage, and altered traffic flows.
For instance, ongoing upgrades on the I-5 and the expansion of State Route 99 have been shown to disrupt traffic flow, which contributes to higher accident rates.
Significant investments are being made to improve these conditions.
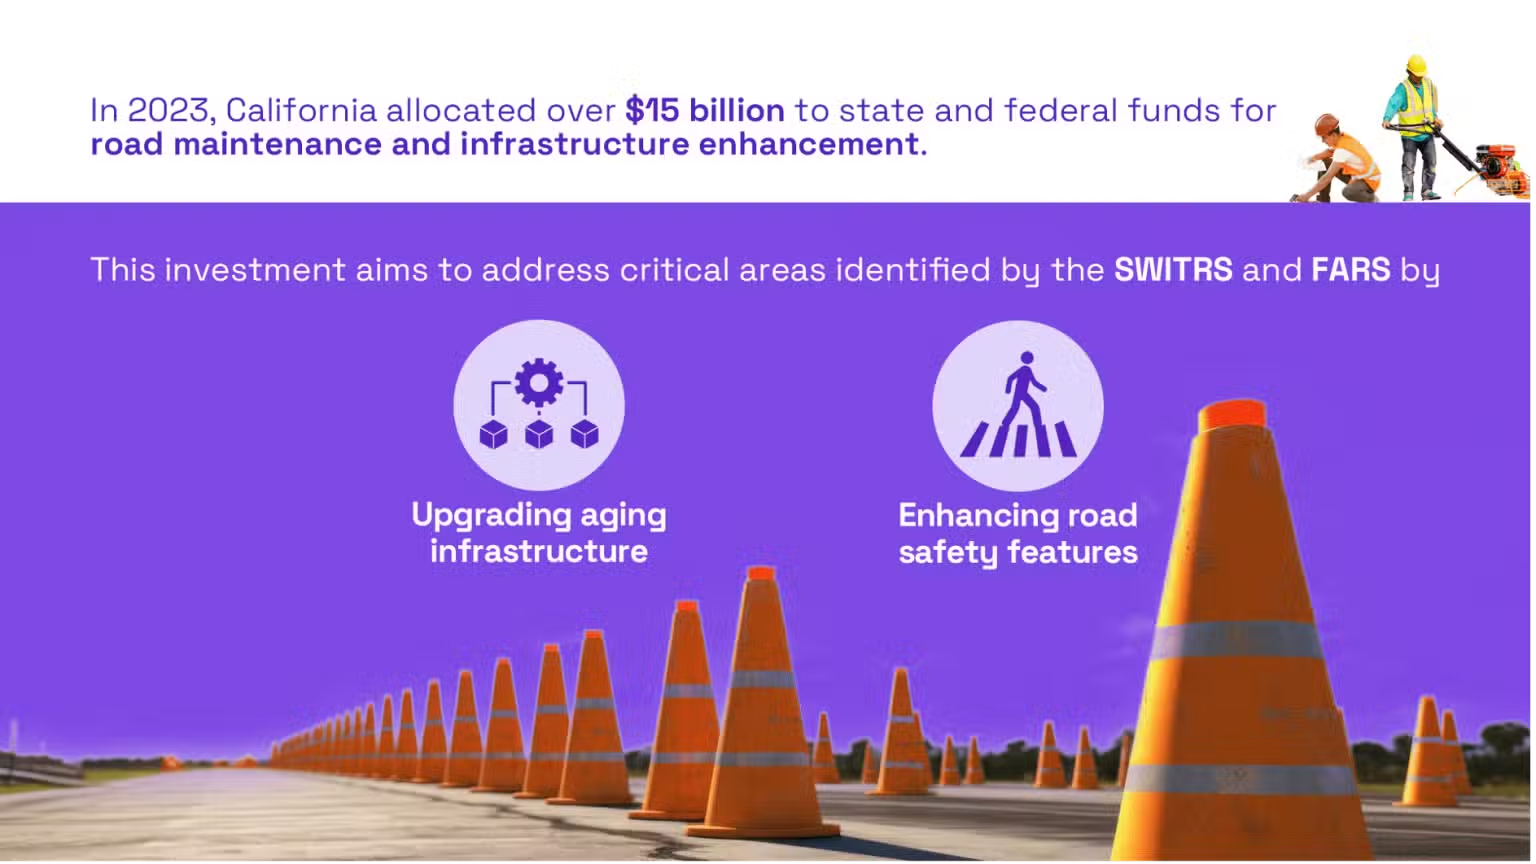
In 2023, California allocated over $15 billion to state and federal funds for road maintenance and infrastructure enhancement. This investment aims to address critical areas identified by the SWITRS and FARS by upgrading aging infrastructure and
The Road to Safety: Navigate California’s Traffic Challenges and Solutions
This report highlights the need for targeted actions to enhance road safety across California. Given the rise in traffic fatalities and ongoing infrastructural challenges, policymakers must intensify efforts to improve road conditions and enforce traffic laws.
We recommend increasing public awareness campaigns, expanding driver education programs, and investing in road maintenance. Community involvement in promoting road safety and adherence to driving regulations can significantly reduce accident rates.
Together, we can work towards safer roads and a more secure driving environment for all Californians!

Michael Avanesian, the founder and driving force behind Avian Law Group, is a passionate and dedicated attorney with a strong background in personal injury law. As a partner at JT Legal Group, Michael led the growth of the personal injury practice from a single employee to a team of over ninety professionals, securing over $2 billion in settlements for clients in just three years.